If a buyer is submitting an offer on your home, you want to know if they can afford it right?
.
Here is what the buyer will turn in to you when they submit an offer:
.
-their purchase contract
.
-their pre approval letter from their lender
.
-their bank statement, AKA, their proof of funds
.
The last 2 will show you if they can get a loan and if they have the cash for the down payment.
Home remodeling market at an all time high and the opportunity for folks looking to sell.
Amid all the news surrounding low inventory of homes and low building starts, another opportunity is getting less attention--the wave of remodeling. Here's what it means for folks looking to sell.
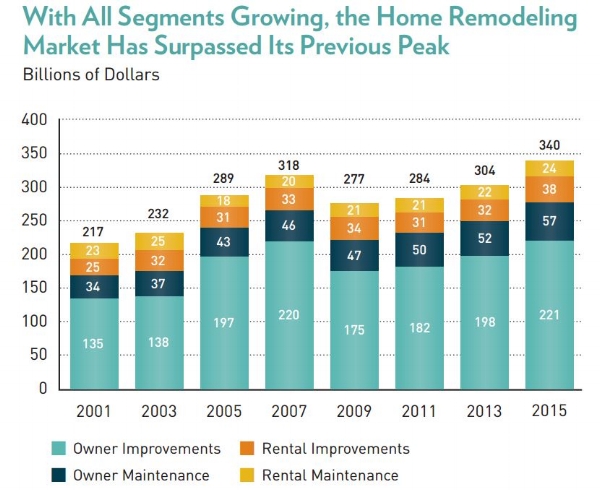
Harvard's Joint Center for Housing Studies recently published data showing a significant rise in the remodeling of homes in the US. In 2015, remodeling in the US totaled $340B a 57% increase since 2001.
Across the board, homeowners and renters alike are spending more money on their homes. And it's true among all demographic groups and cities throughout the US. This appetite for remodeling brings with it many opportunities.
For homeowners looking to sell, I see this as a growing appetite for fixer uppers. Yes, plain and simple. In a previous post regarding Arcadia, I mentioned homes listed below the median selling price have an advantage given the near-term equity potential. This is only strengthened by the increasing propensity of buyers looking to remodel.
From a marketing and positioning standpoint, I think there are many creative ways to target buyers who have a strong appetite and the cash for remodeling. In fact, my wife and I were those exact buyers a year ago. They're out there!
If you're looking to sell and want to talk strategy, reach out. I can tell you what Contempo Realtors can do for you in terms of positioning your home to the best buyers.
Analysis: A quick take on Arcadia and residential properties with near-term upside.
Over 100 residential properties have closed in Arcadia in 2017 and about 200 are currently active and listed for sale. Here's what the data tells us about this coveted LA community.
Key Takeaways:
- Of the 100+ homes sold in Arcadia in 2017, the average selling price has been $1.4M, while the median is $1.1M. Although average is greater than median, we're seeing a much tighter band in Arcadia relative to the rest of LA, so homes are more normally distributed in terms of price.
- Average days on market for homes sold is 64, while median is 50. Generally speaking, homes are sitting on the market for about 2 months before selling. This is more or less true across all price points in Arcadia and is higher than the LA average by about 10 days.
- There are currently 20 homes listed in Arcadia below the $1M price tag. And with most selling prices in the $1.1M - $1.4M range, this means lots of potential upside for buyers and an opportunity to sell for homeowners looking to list below $1M.
So what does all this mean?
Well, first Arcadia is certainly one of the higher priced real estate markets in LA, with most homes going for over $1M. With higher price tags comes more days on market, so patience is key for locking in value for both buyers and sellers.
Well qualified buyers have opportunities to buy below $1M and gain plenty of equity in the near term. Homeowners looking to sell below $1M also have a unique positioning opportunity for home buyers looking to ramp up on equity.
Arcadia is definitely a challenging market given current price points and just stagnation in LA on the higher end of the market. However, there are opportunities in the low end price points that could be attractive for speculative buyers and homeowners who seek them.
We love talking strategy here at Contempo, especially when it comes to positioning difficult homes in what appears to be cold markets. Arcadia is just one example.
If you're looking to sell or looking to buy properties with the most upside, reach out and we can talk strategy.
Sellers can also try our free market analysis to get a view into who you're competing with for the best buyers.
Analysis: Real estate price action in Northridge and what buyers and sellers should know.
We looked at over 230 properties in Northridge either currently active or sold in 2017. Here's what the data tells us about the market and what folks should know if they're looking to jump in or if they're already in the mix.
Here are the key takeaways:
- There are currently 105 active listings in Northridge, 89 are single family detached homes and the rest are condos / town houses. This is the size of the active pool buyers are considering if they want to move to Northridge. For sellers, this is your larger competitive pool.
- The average price is $839K, while median is $755K. When average is greater than the median, this means there are a handful of really expensive homes pulling the average up (very common in LA).
- In terms of size, we have a pretty normal distribution--both median and average are around 1640 sq ft, on the larger side relative to the rest of LA.
- Out of the 105 listings, 32 have changed their price. Most of which (about 85%) have been price decreases. The average price decrease is $33K while median is $22K.
- 134 properties have closed in 2017 thus far. Median selling price is around $600K, while average is $635K. Average days on market is about 53, median is 38. This is the sweet spot for sellers as we move into the selling season.
Okay so what does all this mean?
First, in terms of active listings, Northridge is a very competitive market!
A big chunk of homes are around the same size, but have significant variance in price. This means plenty of room to negotiate for buyers, and pressure on sellers to defend value. I love this sort of competition. We're seeing this play out in the price action.
Second, we're seeing price action for almost 30% of active listings, with most lowering their price. Agents and their clients seem to be jumping in with high expectations and unfortunately weak marketing skills, because prices are dropping.
Finally, based on the data of closed deals in 2017, we're seeing houses at the lower price points close. This makes total sense right now. With a pretty normal distribution of size, buyers are grabbing deals at the lower end because these homes have the most upside.
This is the type of action I like to see and it's the type of competition I like to get into. If you're looking to jump in the market, or perhaps you're already there, reach out and we can talk strategy.
Analysis: Active residential listings in LA and where there's lots of action. (Part 2)
We analyzed 2000 residential properties sold in 2017 thus far. Here's what we learned about what's selling, at what prices and at what volume. This is especially useful for homeowners looking to sell and get into the market mix.
Key takeaways:
- About 2000 residential property deals (from single family homes to condos) have closed in 2017 year-to-date (**see areas below). The average close price is about $1M, while the median is about $700K. In other words, these are the prices homes are typically selling for across the greater LA area.
- These prices are dramatically different from what we're seeing in the current active listing space. If you recall from the previous post, the average price of active listings is $2.2M while the median is $988K. These are 200% higher than the average and 50% higher than the median of what's actually been closing.
- Almost 50% of deals are for properties between 1000 - 1500 square feet. This is where the bulk of the competition is highly concentrated. These homes are selling for anywhere between $600K - $800K on average. These are pricing anchors for sellers who want to charge closer to $1M for homes within this size range.
- Interestingly, 25% of deals are for homes above 2000 square feet. This highlights the ability of larger homes to take a chunk out of the selling share. Larger homes are definitely closing at a healthy pace, so there's clear demand.
- For homes between 2000 - 2800 square feet, $1.1M - $1.6M seems to be the sweet spot price range based on average closing prices in 2017.
**Areas we analyzed: Los Angeles, Burbank, Glendale, Pasadena, Sherman Oaks, Northridge, Tarzana, Beverly Hills, Granada Hills, Van Nuys.**
So what does this all mean? First, closing prices are way below the prices of active listings, so as we've mentioned, there will be pressure to defend value. We do know that supply is low, so sellers can still have an advantage if they position their homes the right way.
Second, there are pricing anchors for areas where there's high competition in terms of square footage. Sellers should be aware of this and be sure to focus on key differentiators of their homes and neighborhoods that justify prices above median or average.
Interested in talking strategy? We can help. You can also try our free market analysis, and we'll provide something tailored just for you.
Analysis: Active residential listings in LA and where there's lots of action. (Part 1)
We took at look at over 2800 active residential property listings in LA to give you a sense of where there's action and what sellers can expect as the season heats up. Here's what we found.
Key takeaways:
- There are currently over 2.8K active listings in the greater LA area. This includes single family residences, townhouses and condos. This is the size of the active pool in LA that buyers will be considering in the weeks and months to come. As we mentioned in a previous post, however, you can expect this number to increase significantly towards the end of March all the way up to June.
- The median price of all active listings is currently $988K, while the average is $2.2M. When average is greater than the median, this means there is long tail of very expensive properties pushing the stats higher.
- Right now, 1/3 of all listings are well above $1.5M. This is a pretty solid distribution of competition across all price points.
- Single family residencies account for 71% of all active listings (just over 2000 listings). The median value of single family residencies is currently $1.2M across all areas.
- About 10% of active listings (200) have lowered their price by a median reduction of $29K. That's pretty substantial and indicates plenty of competition for the right buyers.
- Beverly Hills and Pasadena have by far the most active listings with about 200 each. In these types of extremely competitive environments, we can expect more downward pressure on price as properties will compete for the best buyers.
So what does all of this mean? It's simple. The season is just getting started and competition is already ferocious.
What I'm most looking out for is price action. Right now 10% of listings are consistently lowering their price. With more listings entering the market, it will be interesting to see what happens to that number.
I still think it's a sellers market. I do think homes need to be positioned strongly to the right buyers so they can uphold their prices. Right now, at least 10% of homes are missing out on the low housing supply advantage.
Are you thinking of selling your home and want to talk strategy? Feel free to reach out. You can also try our free market analysis service to help you with your research.
Analysis: Price action in Burbank and what it says about the competition for ideal buyers.
Burbank is one of the most competitive markets in LA. Recent price action says a lot and buyers and sellers should take note. We analyzed price movements to show you where there's high competitive pressure.
Here are the key takeaways:
- There are 48 active listings in Burbank for single family residences. This is the size of the active pool buyers are considering if they want to move to Burbank. For sellers, this is your larger competitive pool.
- The average price is $973K, while median is $820K. When average is greater than the median, this means there are a handful of really expensive homes pulling the average up (common in LA).
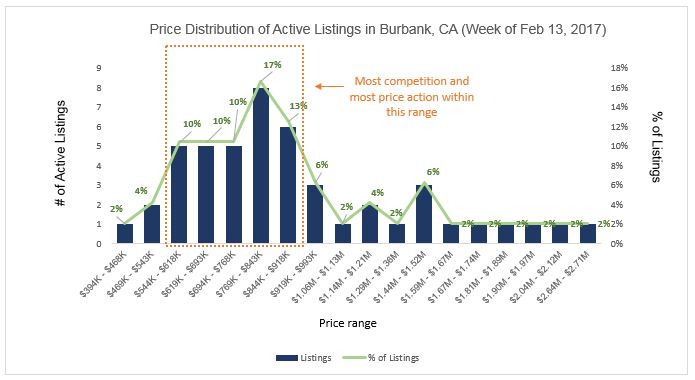
- Two-thirds of active listings are between $540K - $900K. This is where we're seeing most of the pricing action. This is the meaty part of the market.
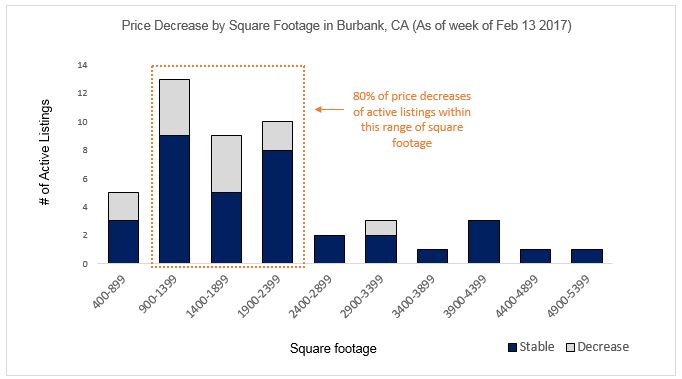
- Since December 2016, we've seen 13 price decreases among active listings. That means 27% of all active listings in Burbank have lowered their prices.
- The average price decrease is $21K, median is $15K. This is especially interesting considering many believe this is a sellers market (low supply high demand).
- What we're actually seeing is an overestimation of value and weak positioning of homes for almost a third of active listings in Burbank.
It will be interesting to see what kind of price action we'll see in the future, especially as more listings flood the market this spring. This is something buyers and sellers should pay attention to closely, especially if they wanna jump in the market.
It's only gonna get more competitive, so you need to be prepared. We can help. Try our free market analysis service. We'll get back to you with a tailored assessment of your market.
Analysis: Active listings in Torrance and what it means for sellers.
Torrance is the "hottest" market in LA right now. So what do potential sellers need to know about the competition? We analyzed current listings to show you the lay of land--what it will take to succeed and where we expect to see key challenges.
Here are the key takeaways:
- There are 63 active listings in zips 90504, 90501, 90505 and 90503. This is the size of the active pool buyers will be considering if they want to move to Torrance. For sellers, this is your larger competitive pool.
- The average price is $795K, while median is $750K. When average is greater than the median, this means there are a handful of really expensive homes pulling the average up. In reality, most homes are closer to $750K or much less.
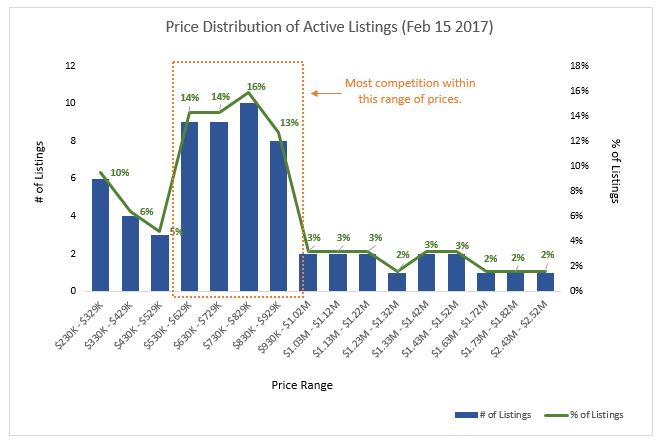
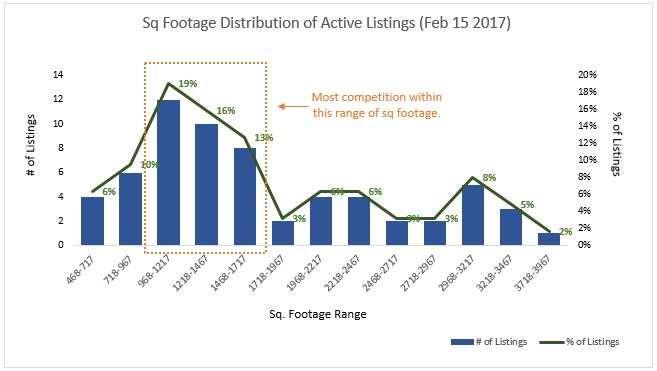
- Almost 60% of active listings in Torrance are between $530K - $930K. This price range will have the most competition. Sellers in this range must be prepared to defend what makes their property different. See the distribution chart below.
- Similarly, 50% of active listings are between 1000 - 1700 sq feet. This range has the most competition and will demand greater differentiation.
- For the 1000 - 1700 sq. foot range, the average prices are between $600K - $735K. Homes expecting prices above the average will face pressure to reduce or defend value.
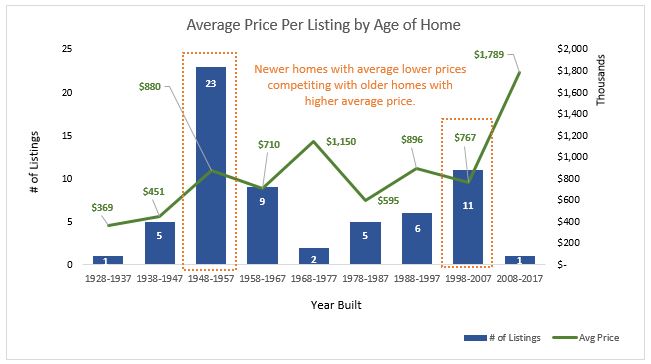
- 23 active listings are for homes built between 1948 and 1957, with an average price of $880K. There are 11 listings for homes built between 1998 - 2007 with an average price of $767K. We expect immense competition between these two groups.
**Please scroll through the charts below.
We love crunching numbers and empowering clients with the ammo they need to be competitive. If you're interested in selling your home, we can provide a similar analysis for you, free. Click here and try our service.
Thinking of selling your home in 2017? Here's what you need to know.
Higher prices and low inventory in LA tell a convincing story for why you should sell in 2017. Many agents are clearly pushing for this narrative. While I generally agree, I always tell folks it all depends on what your objectives are. So here's what you need to know.
1. Keep an eye out on mortgage rates (because your potential buyers are). The 30-year fixed rate in LA ticked down to 4.47%, but is still above the national average. Nevertheless opportunistic buyers (especially those with great credit) will be watching this closely looking to lock into a good rate early. If interest rate expectations hold, expect to see the bulk of loan applications crowd into Q1 and Q2 of this year because mortgage rates will likely go up by end of year.
What this means for you: Get to know the pool of buyers coming in now and what they're looking for in a home. This can give you the upper hand early in the game.
2. Know your competition (I can't stress this enough). A dose of reality early in the game is the best antidote for disappointment down the road. If you're looking to sell your home, you're essentially putting a product out in the market that is competing with others. Some will have different designs, some will have been recently renovated, the list goes on. Here's my point. Ideal buyers will value your home relative to what else is out there.
What this means for you: View the market from multiple angles beyond just price and CMAs. Know how many homes you'll be up against, how they break down by distinct features and designs and who the ideal buyers are in your area. Knowing the demographic shifts are also key in understanding who are the most likely buyers of your home--most CMAs miss this entirely.
3. Higher prices and low inventory can also work against you. Selling your home also means you'll be thrown into a market with higher prices and low inventory assuming you're looking to continue to own.
What this means for you: Narrow down your ideal neighborhoods and understand current playing field of available inventory. The more data and knowledge you have, the less susceptible you'll be to the price advantage of sellers.
I encourage home owners to take advantage of market opportunities when they present themselves. But I also encourage them to be armed with the right data and knowledge so they can maximize ROI.
Try our free market analysis service and see what we can do for you.


